
| Grayscale | Color | ||||||||||||||||||||||||||||||||||||||||||||||||||||||||||||||||||||||||
|---|---|---|---|---|---|---|---|---|---|---|---|---|---|---|---|---|---|---|---|---|---|---|---|---|---|---|---|---|---|---|---|---|---|---|---|---|---|---|---|---|---|---|---|---|---|---|---|---|---|---|---|---|---|---|---|---|---|---|---|---|---|---|---|---|---|---|---|---|---|---|---|---|---|
|
|
| Rank | Score | Algorithm | PR Curve |
|---|---|---|---|
| 0 | 0.79 | Humans | |
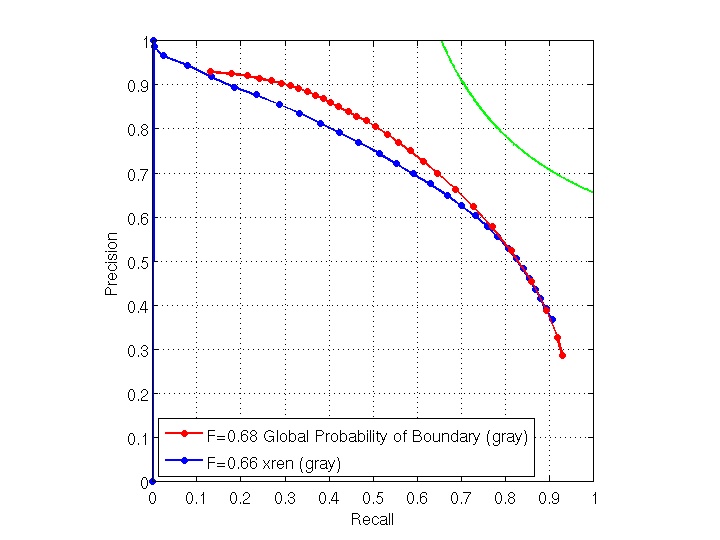
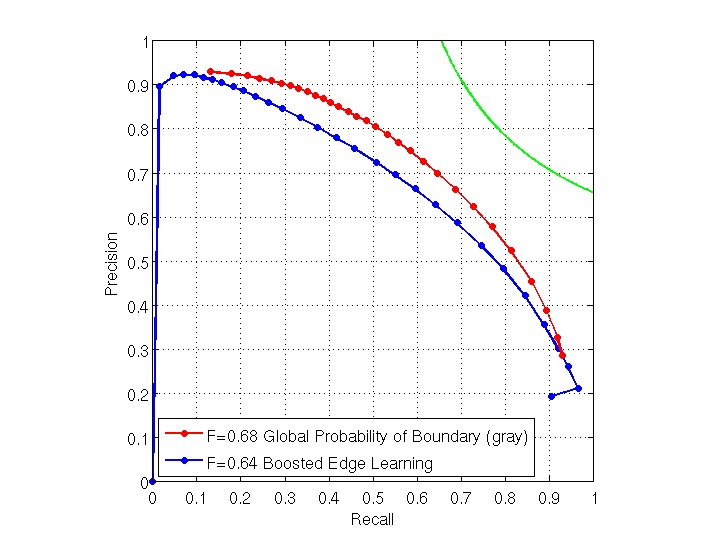
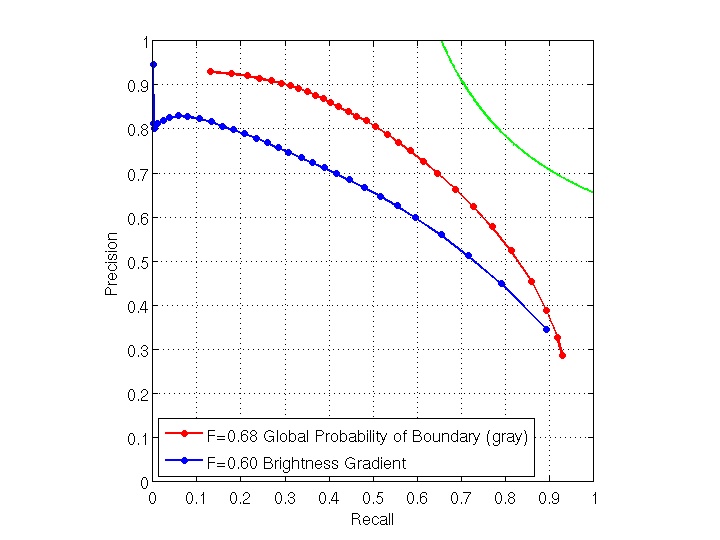
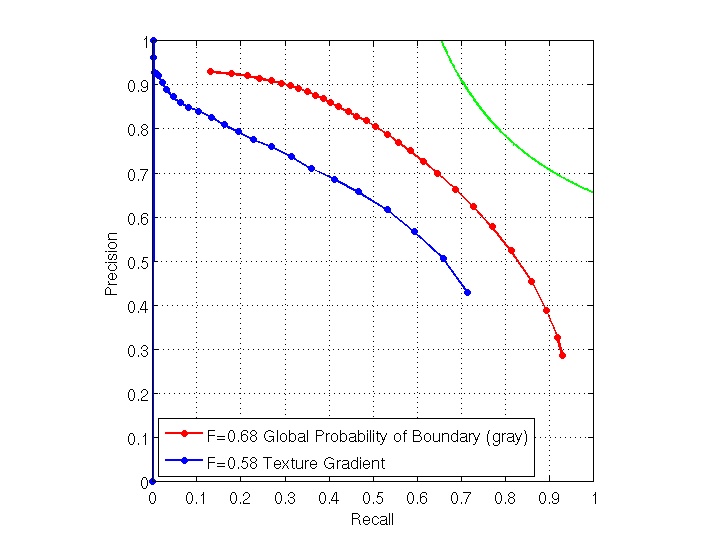
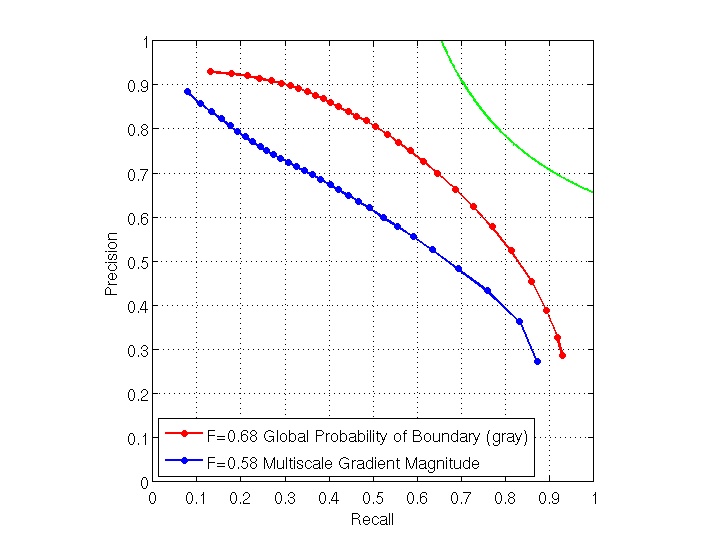
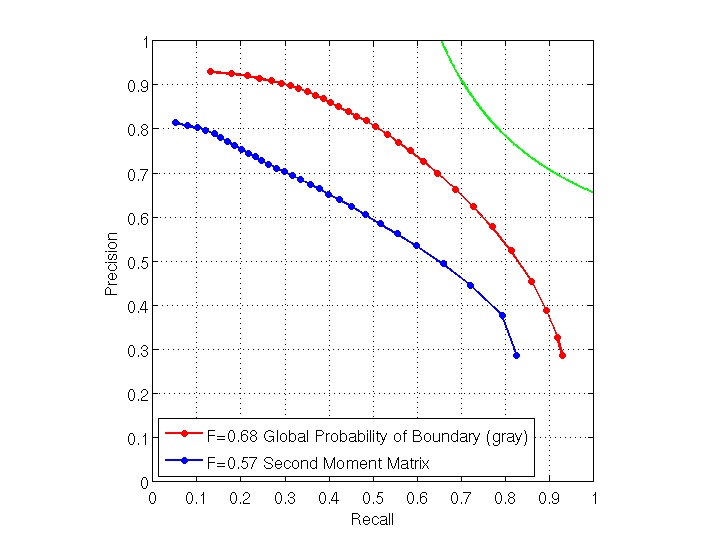
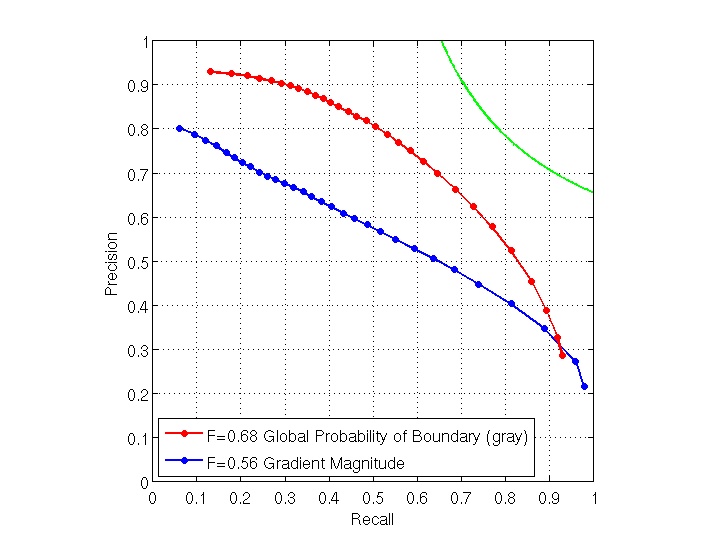
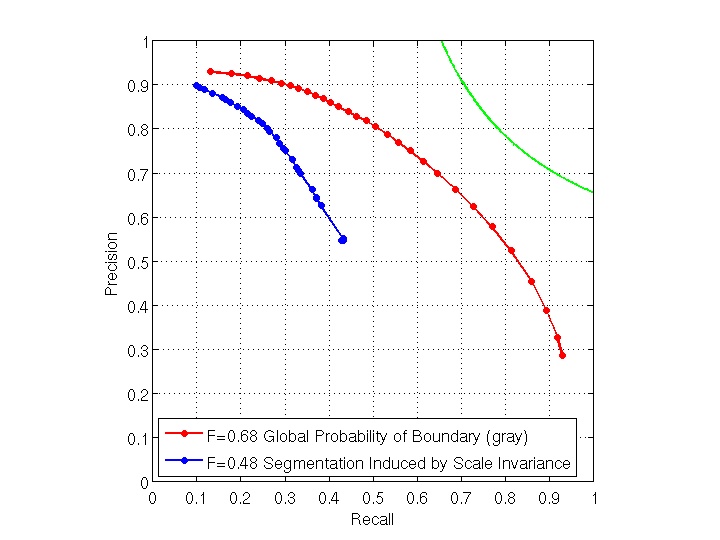
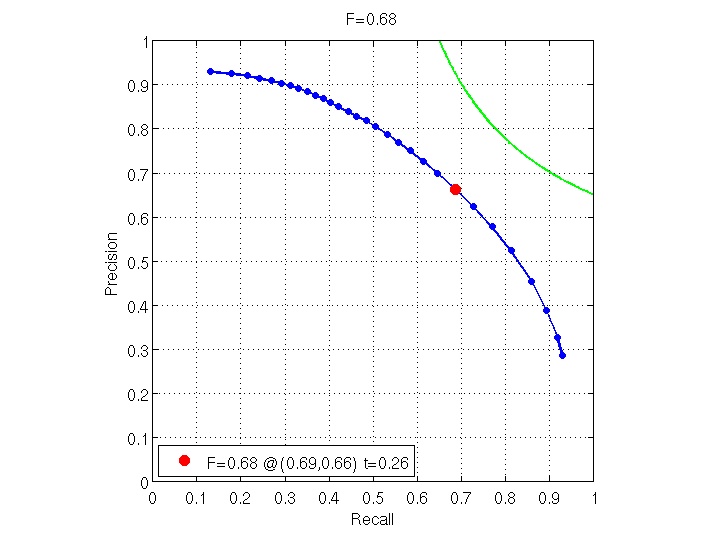
| 1 | 0.68 | Global Probability of Boundary (gray) | |
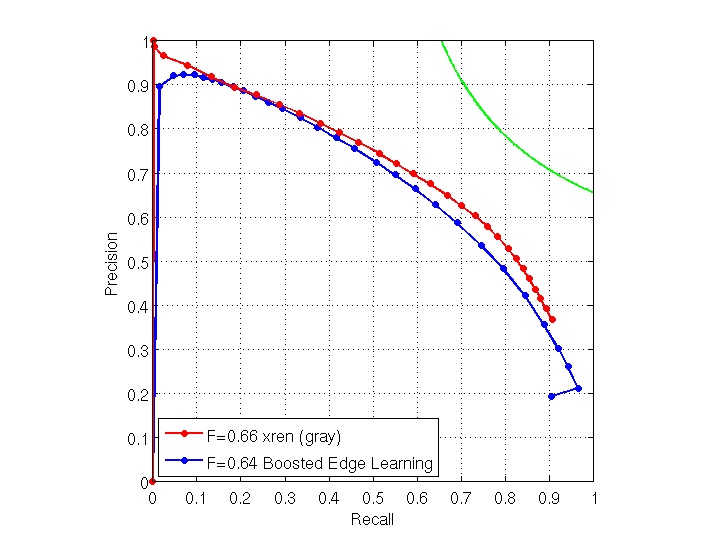
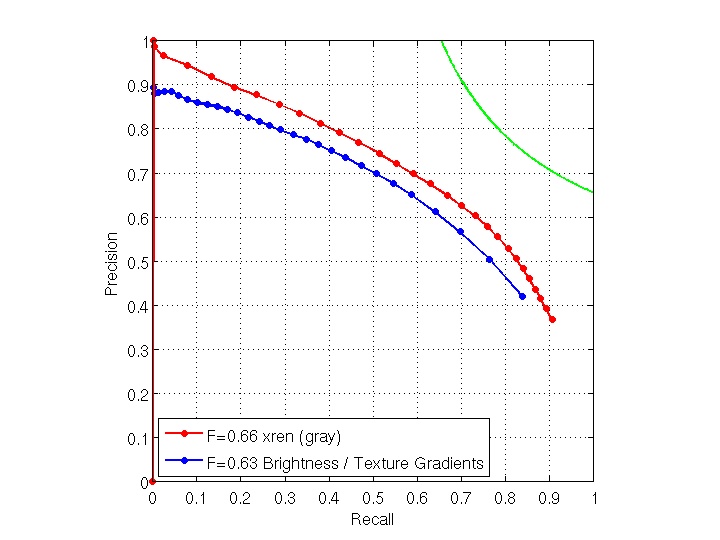
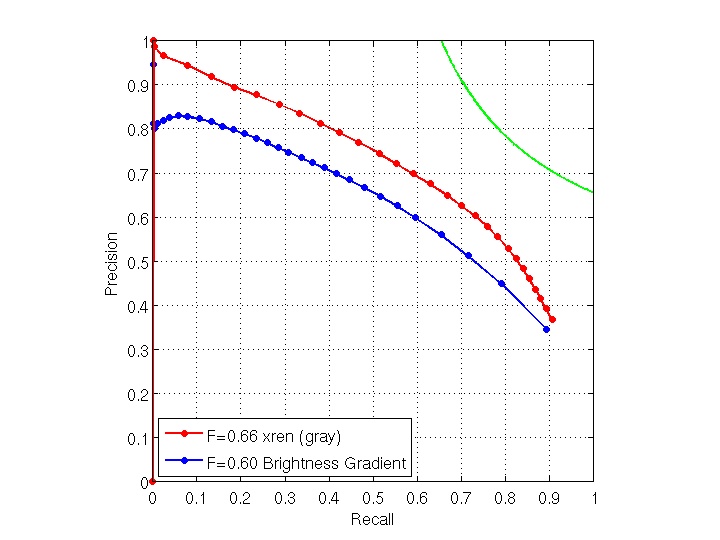
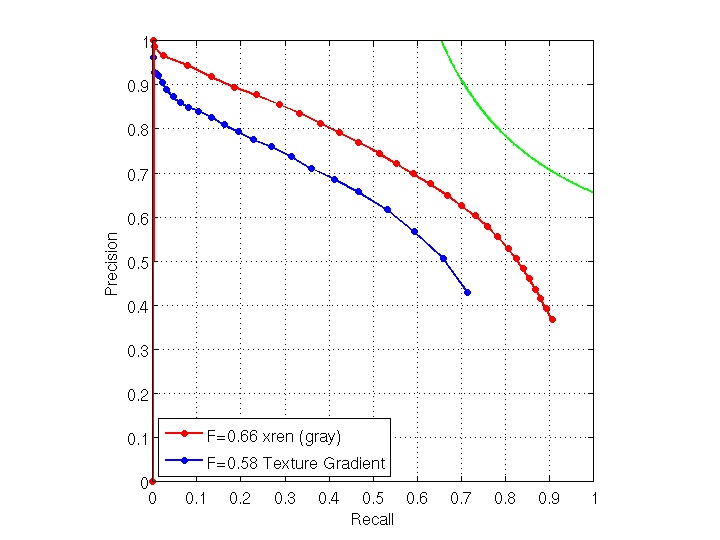
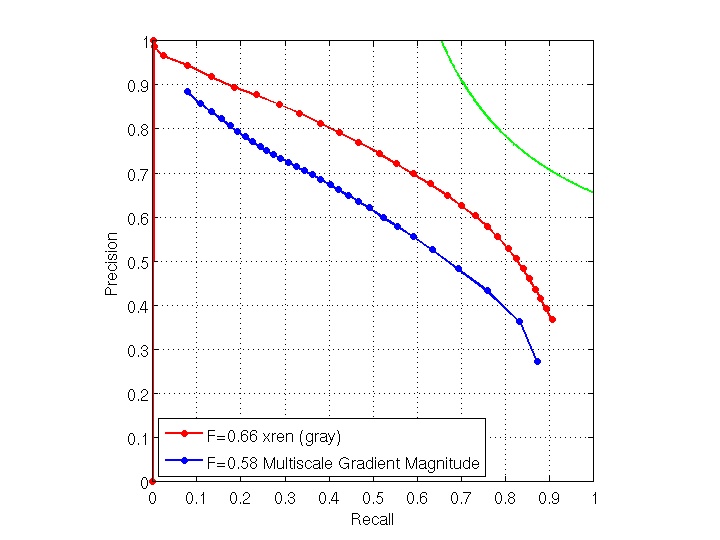
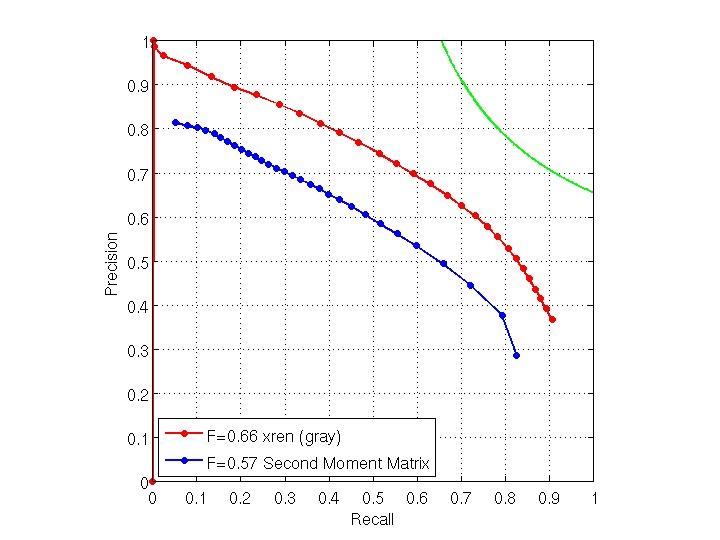
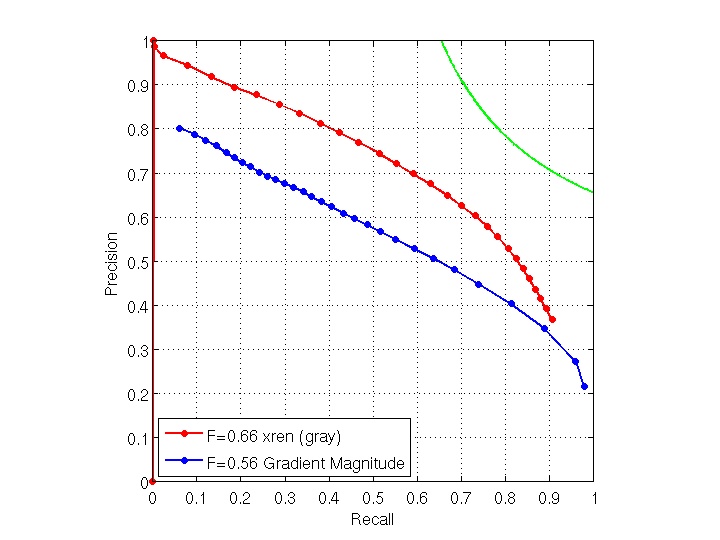
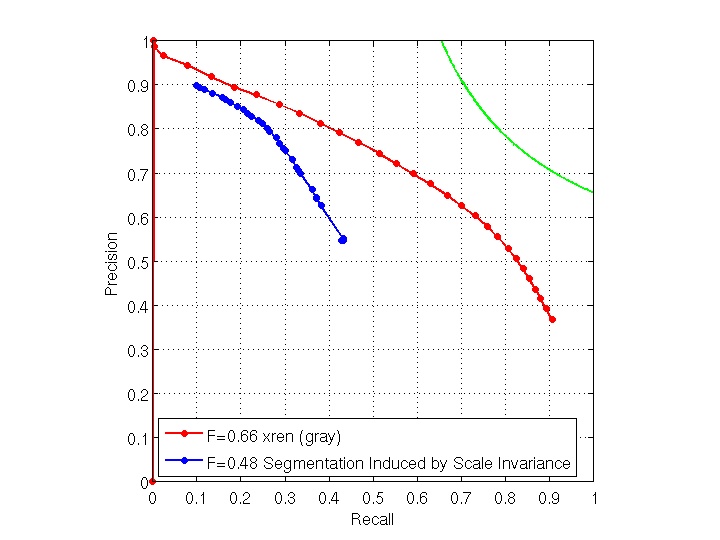
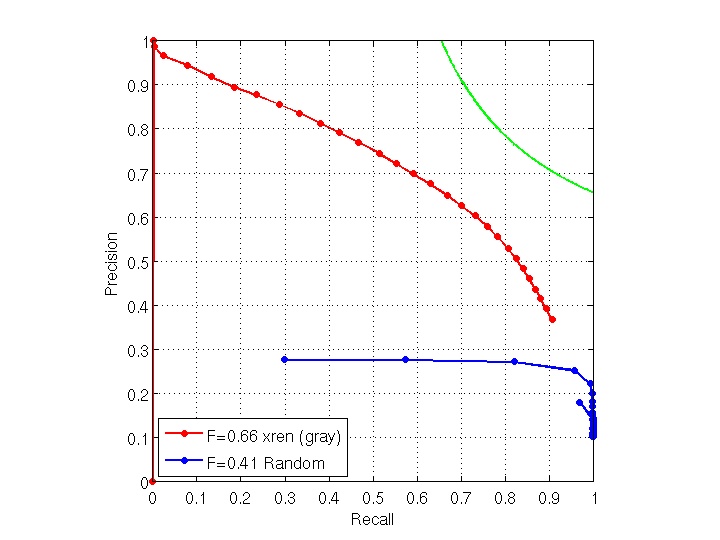
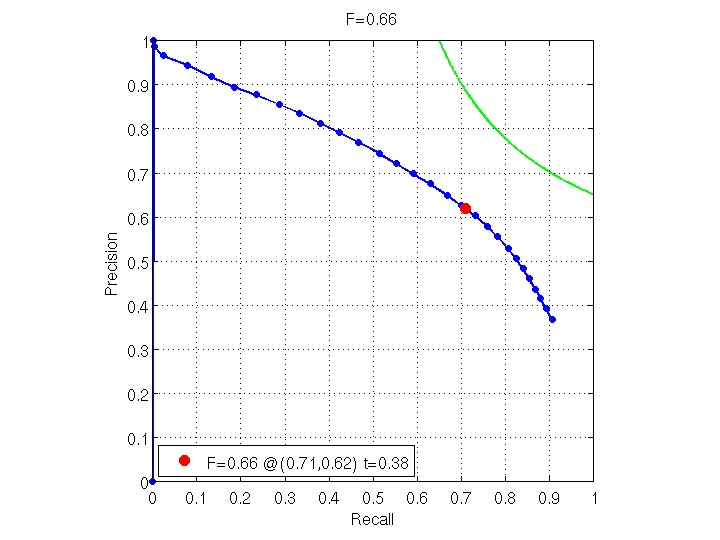
| 2 | 0.66 | xren (gray) | |
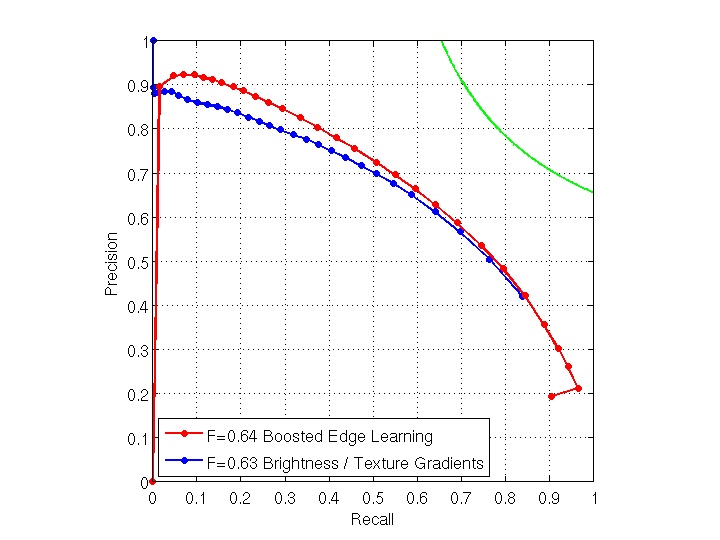
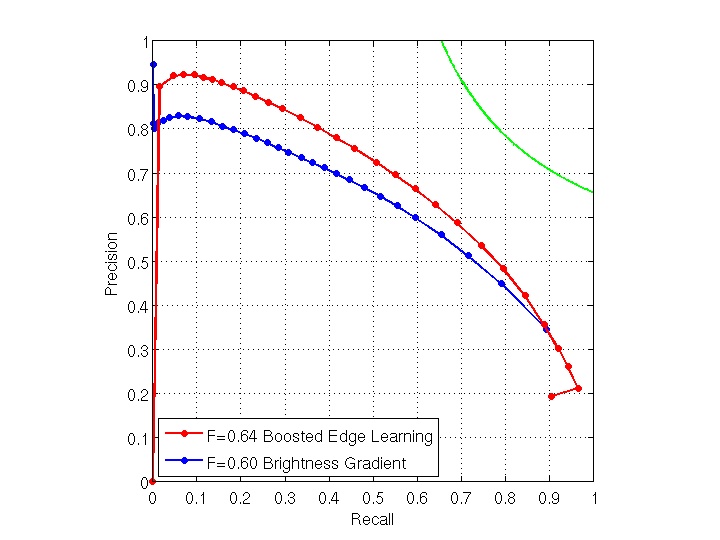
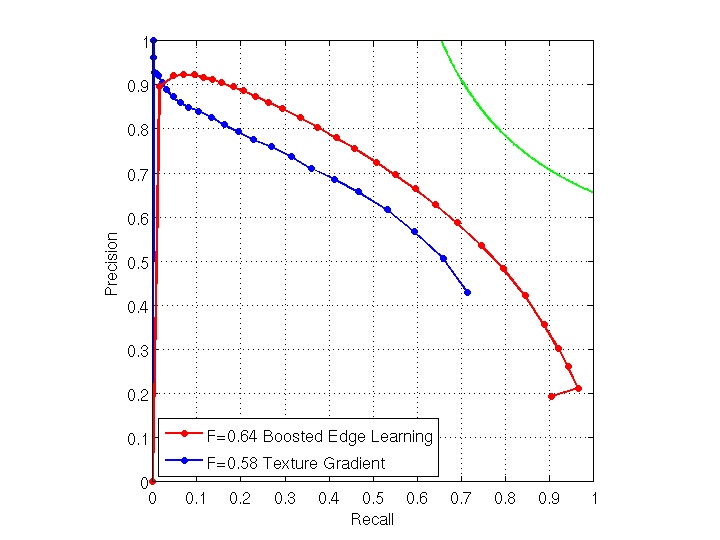
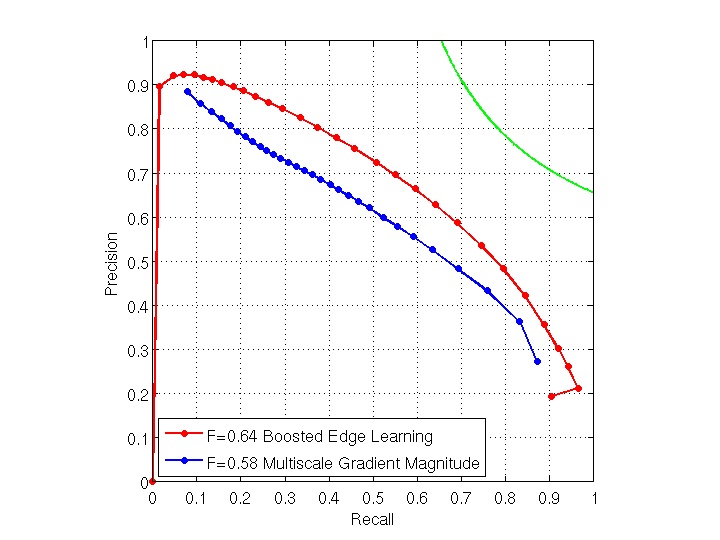
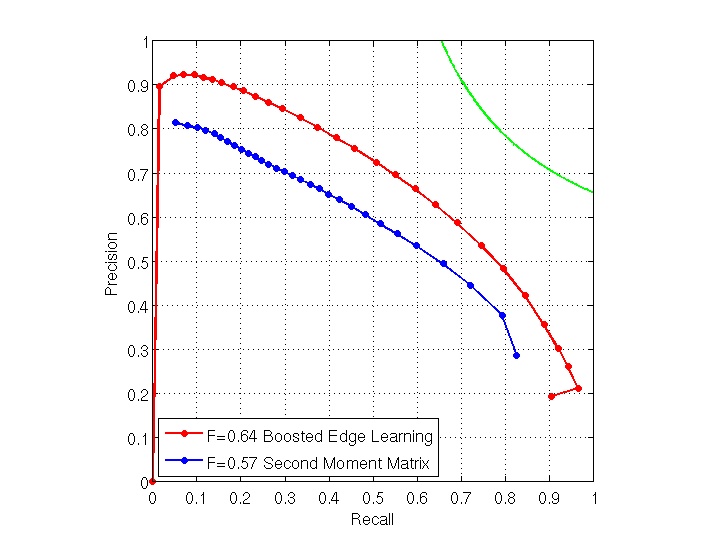
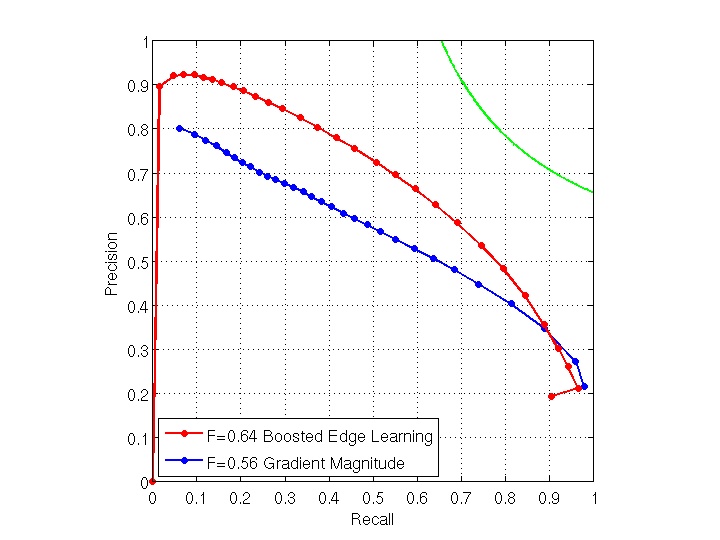
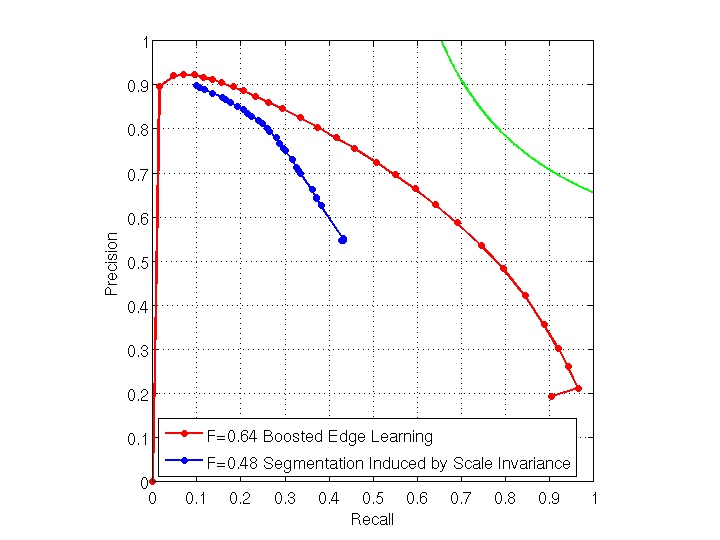
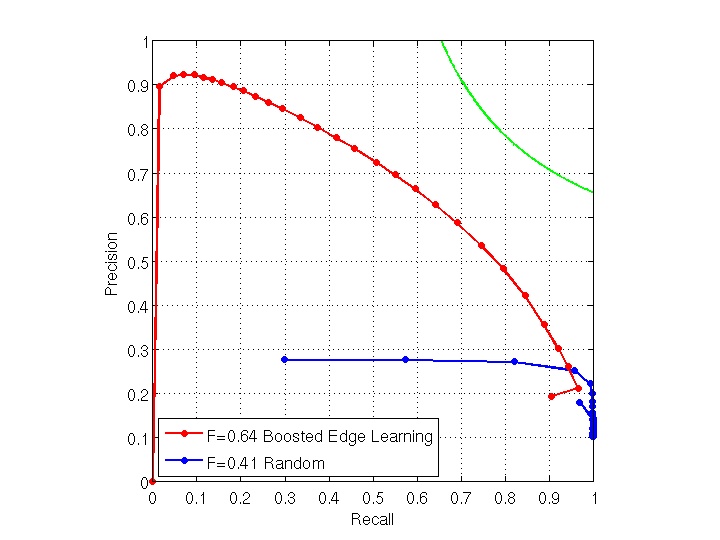
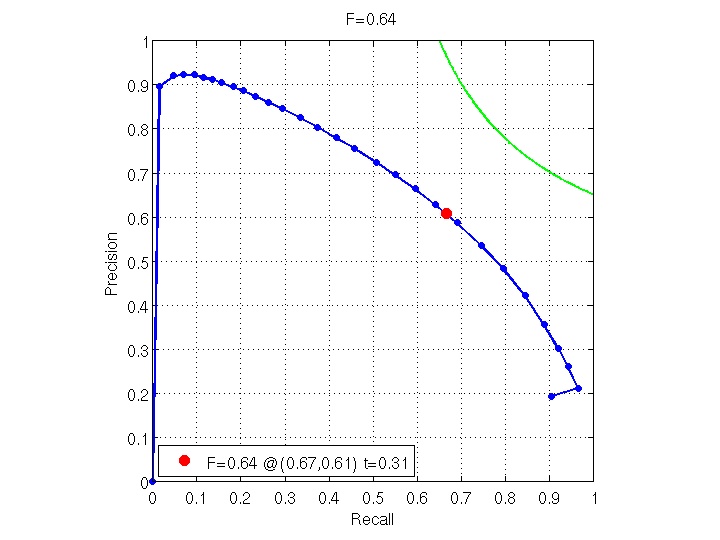
| 3 | 0.64 | Boosted Edge Learning | |
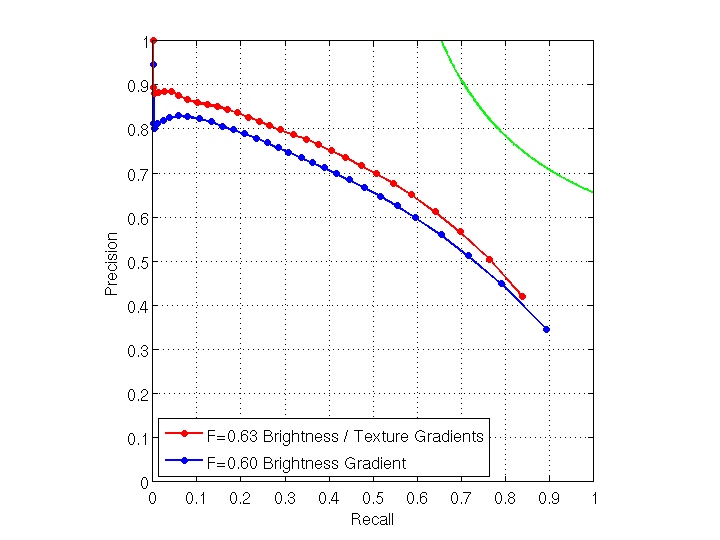
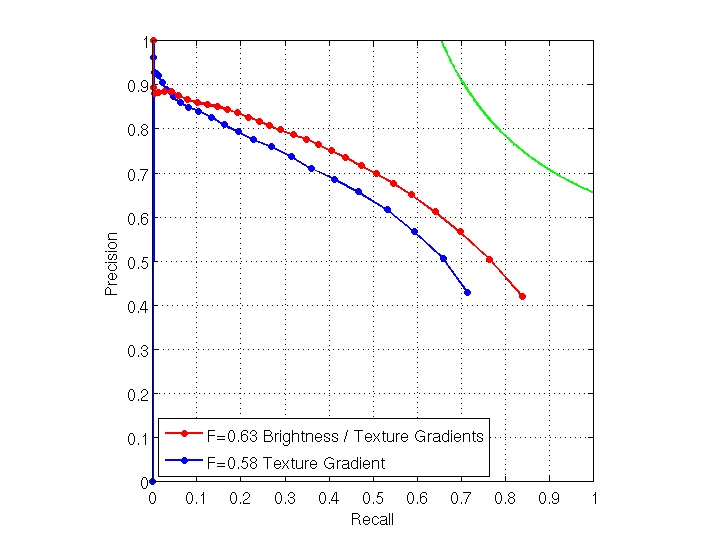
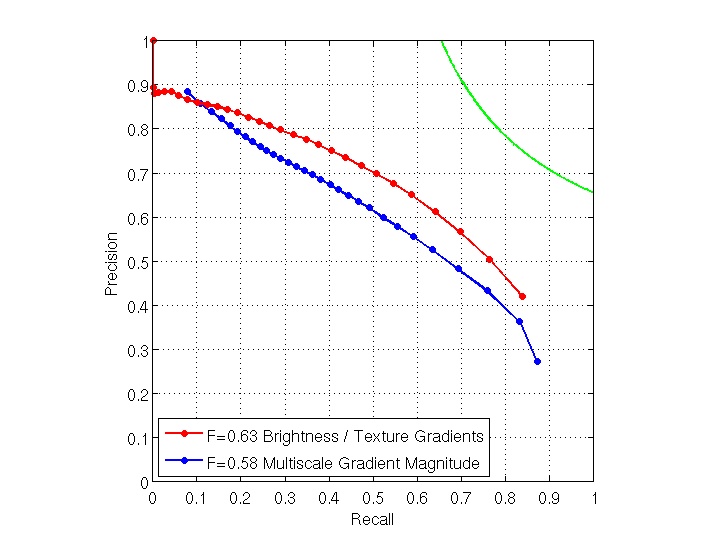
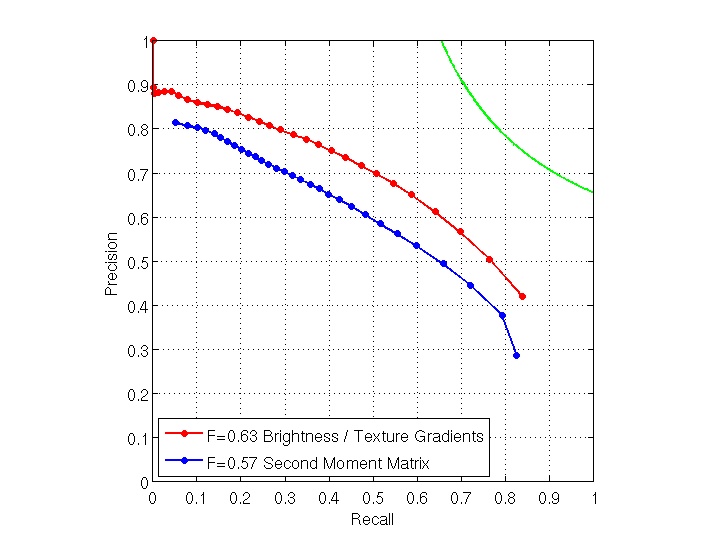
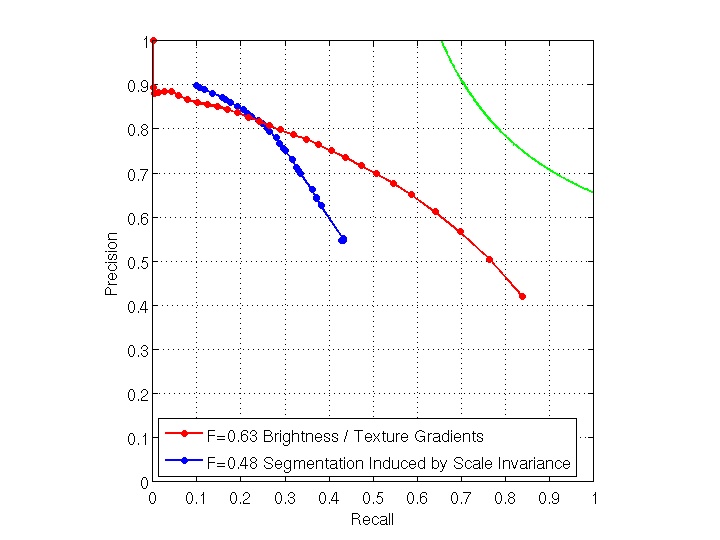
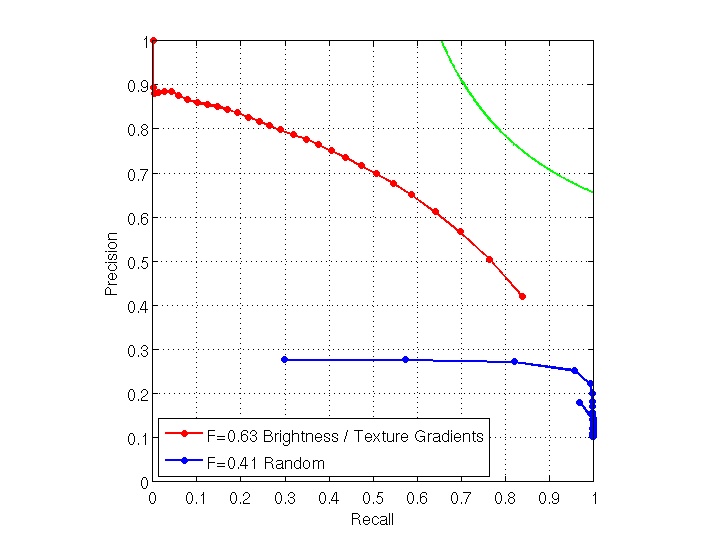
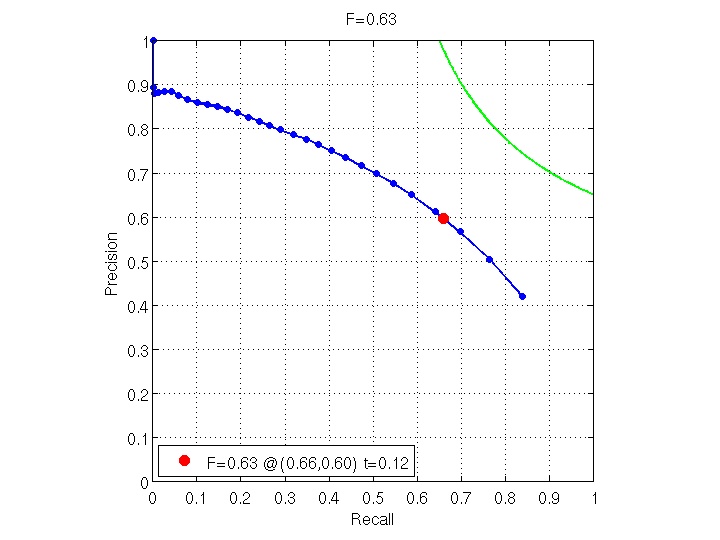
| 4 | 0.63 | Brightness / Texture Gradients | |
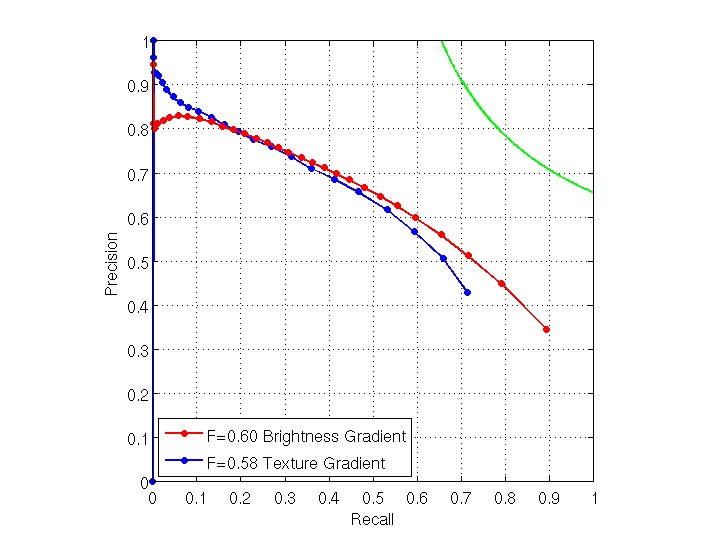
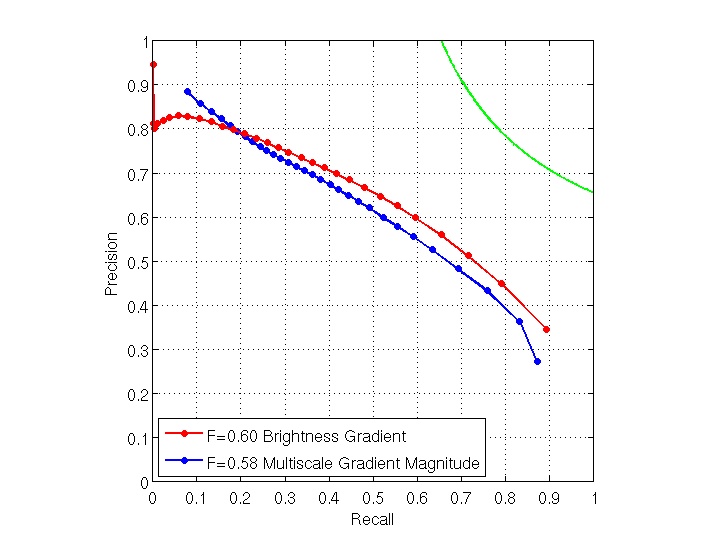
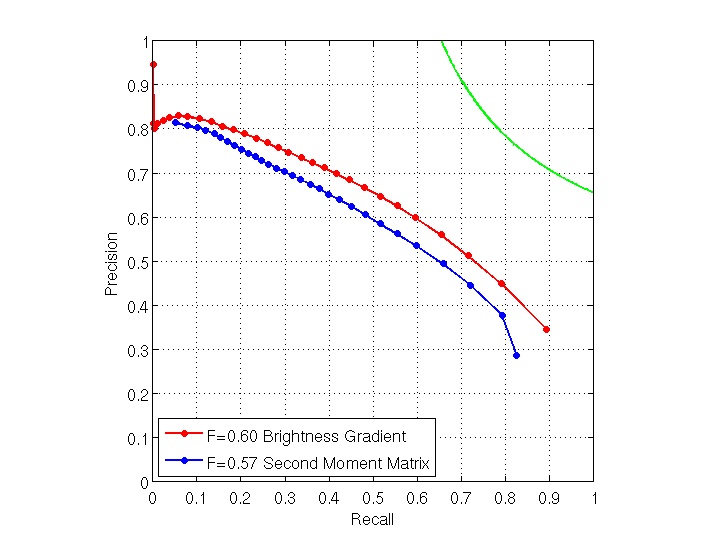
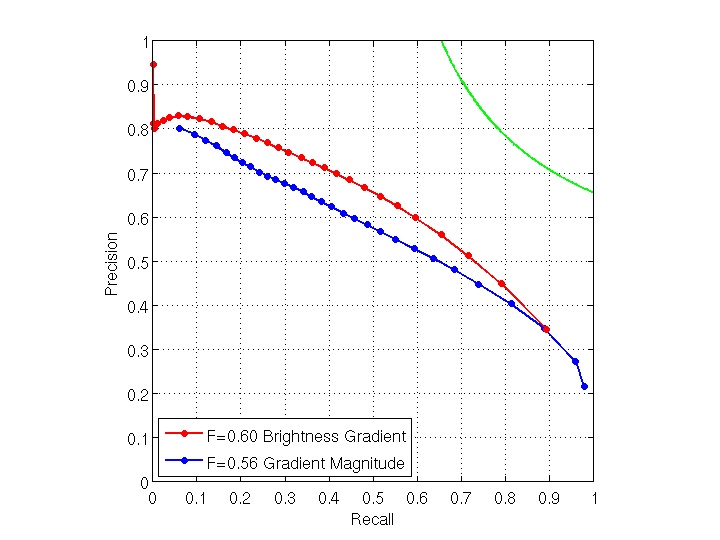
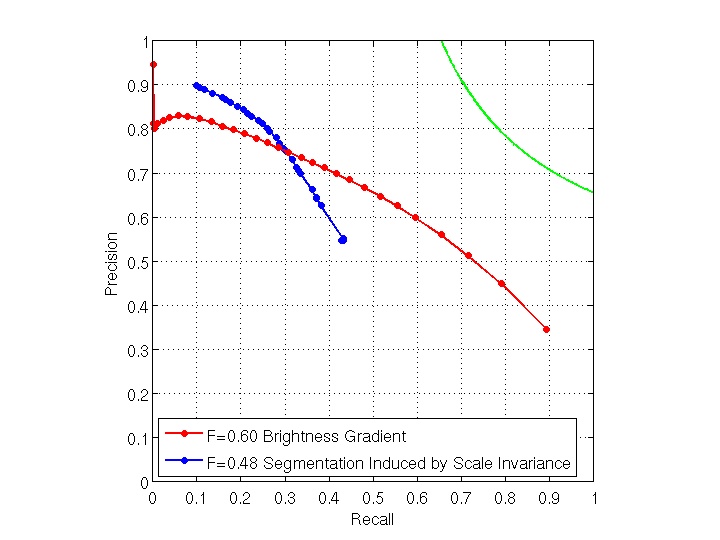
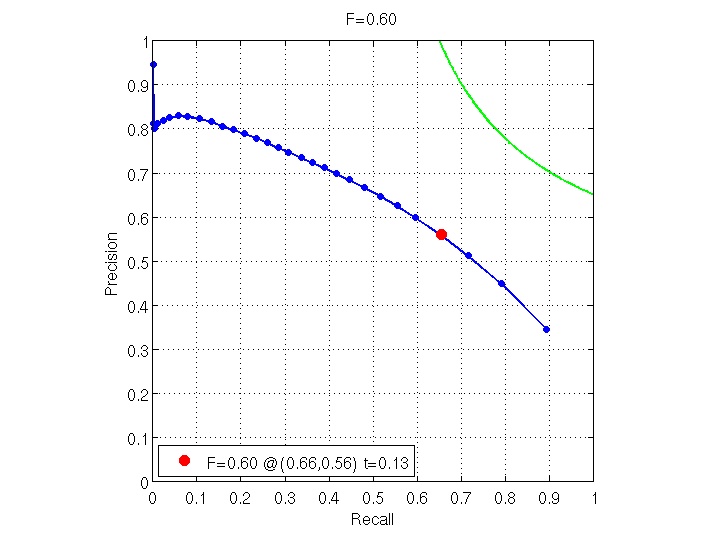
| 5 | 0.60 | Brightness Gradient | |
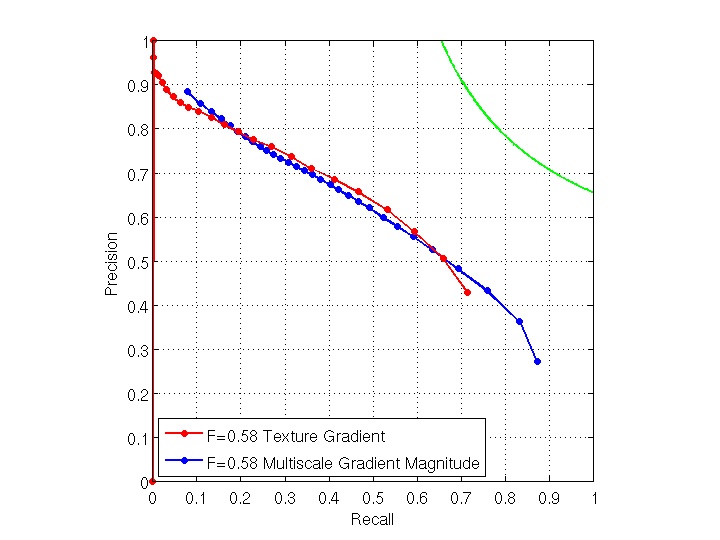
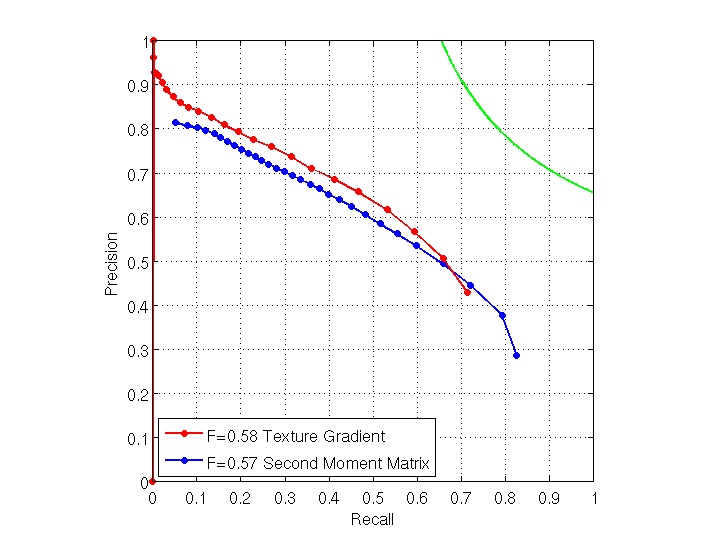
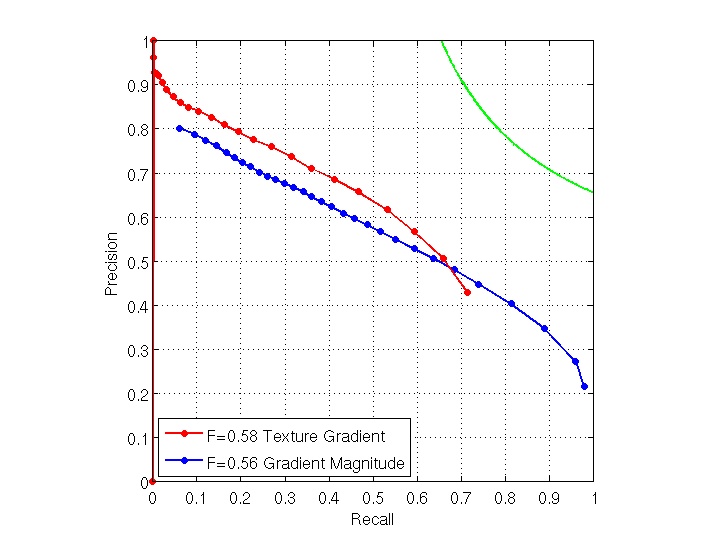
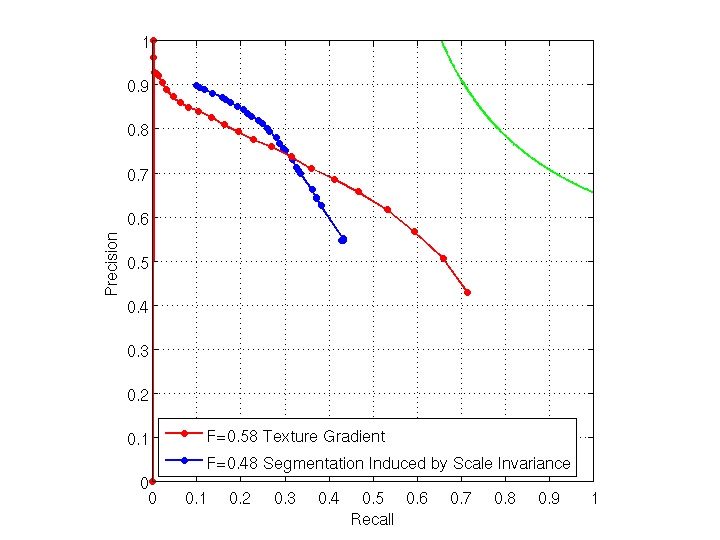
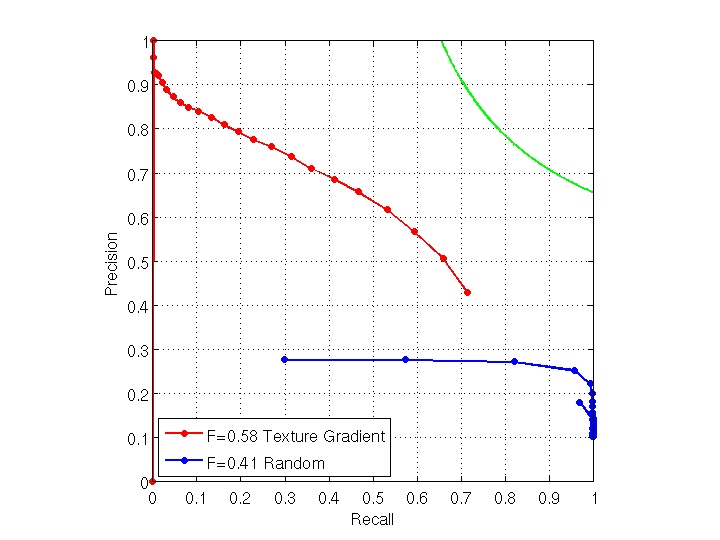
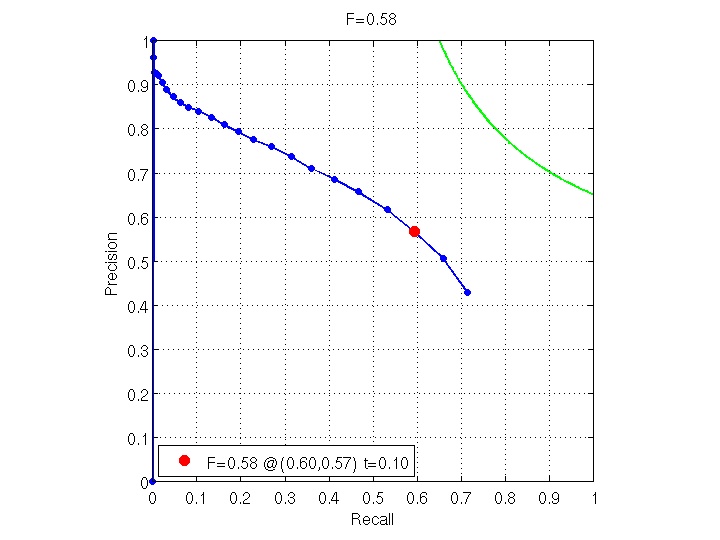
| 6 | 0.58 | Texture Gradient | |
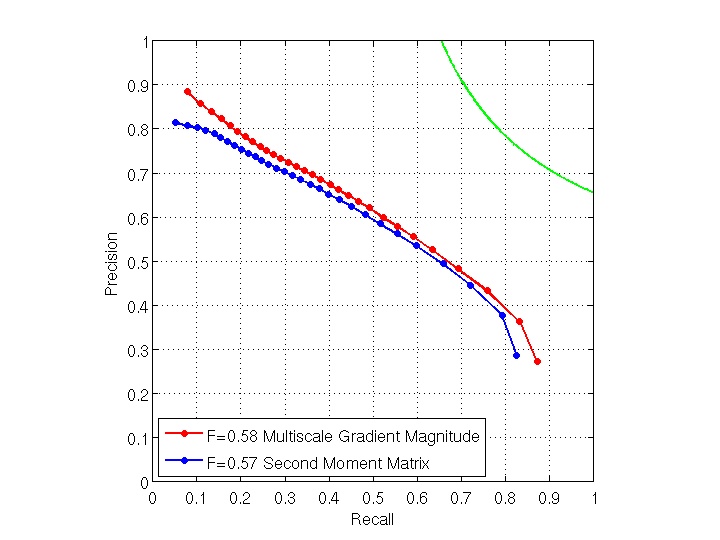
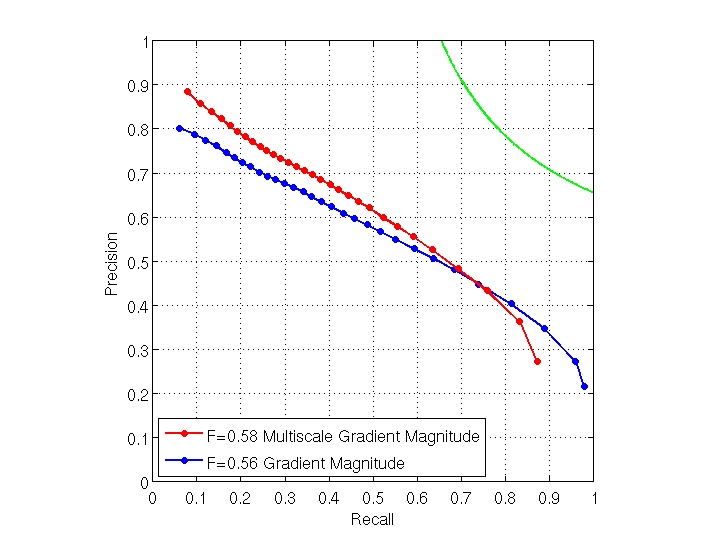
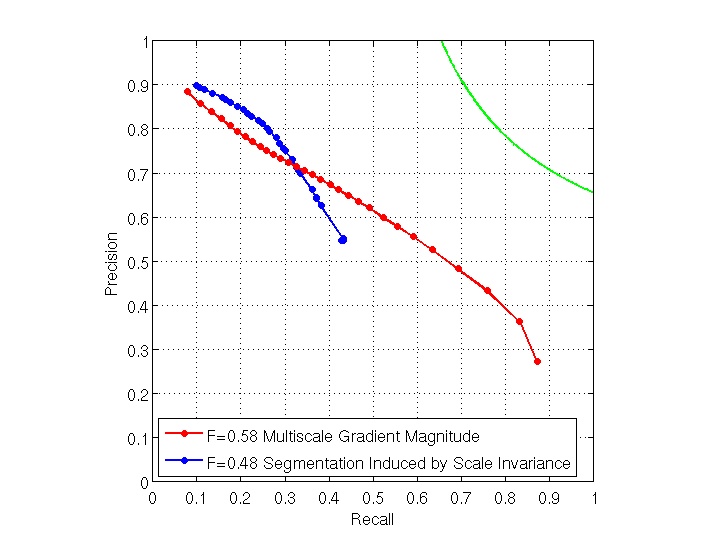
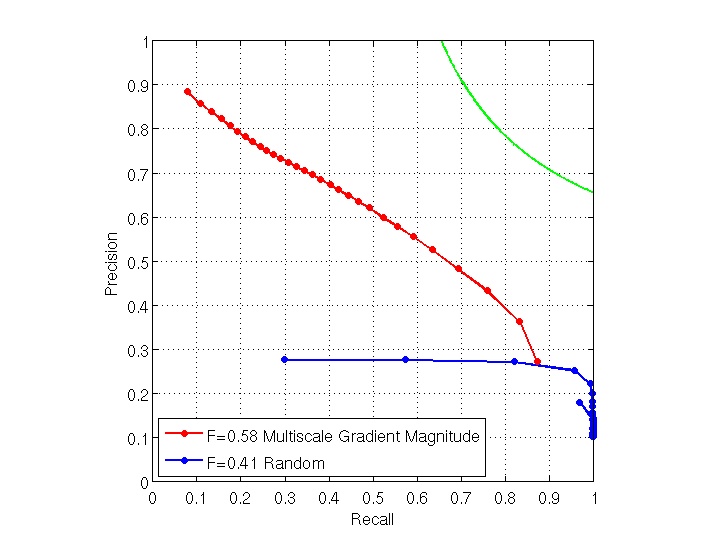
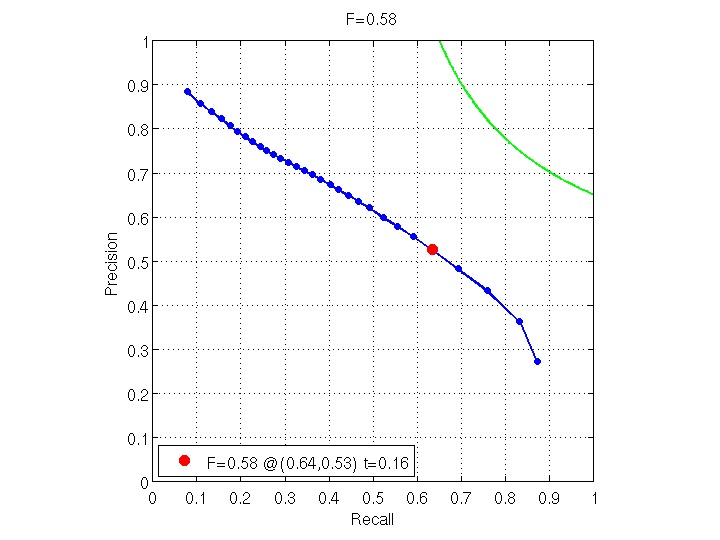
| 7 | 0.58 | Multiscale Gradient Magnitude | |
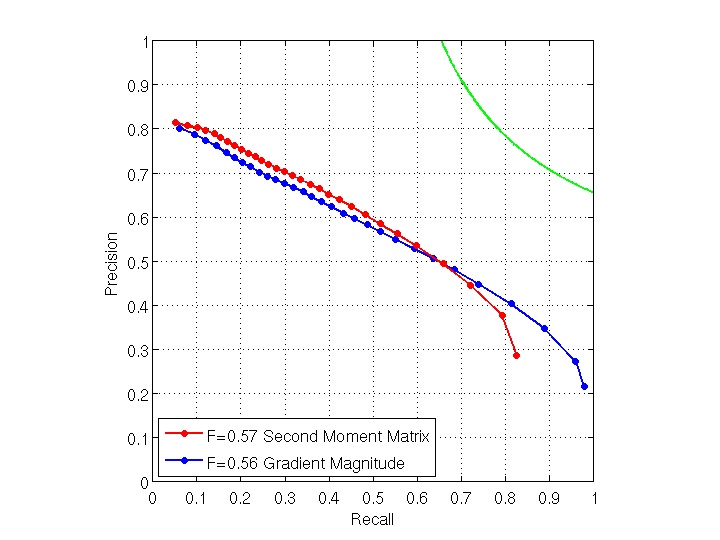
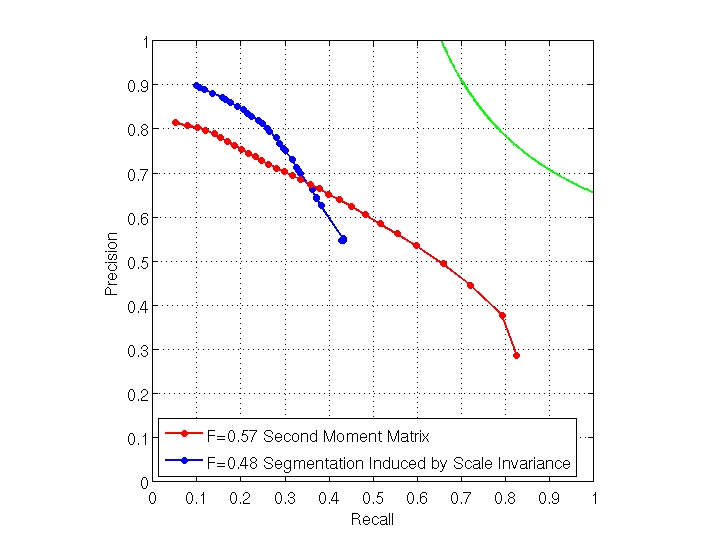
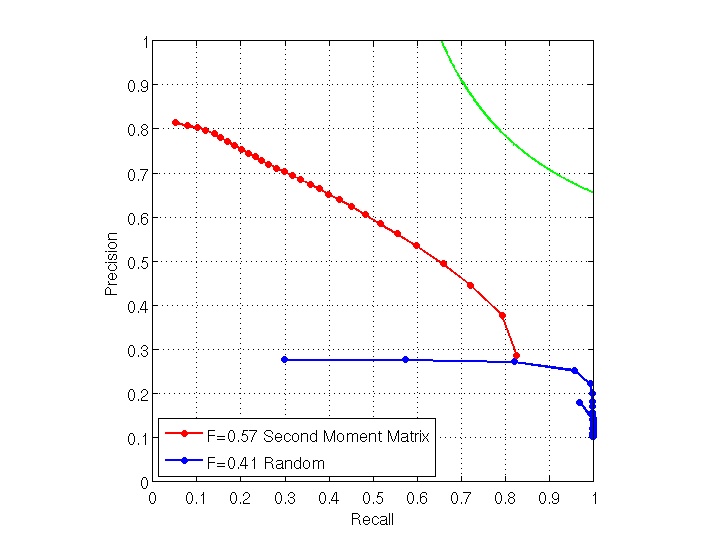
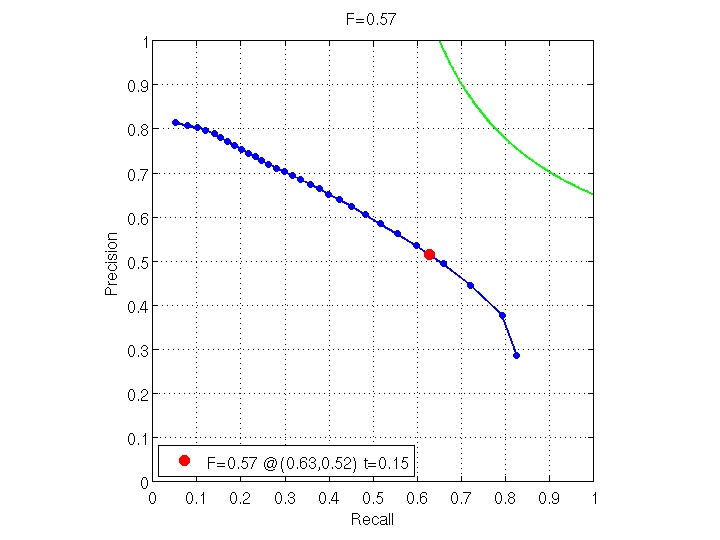
| 8 | 0.57 | Second Moment Matrix | |
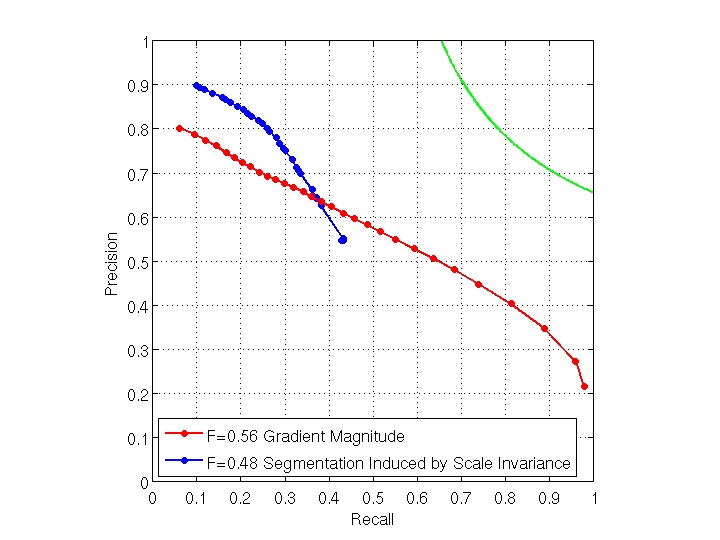
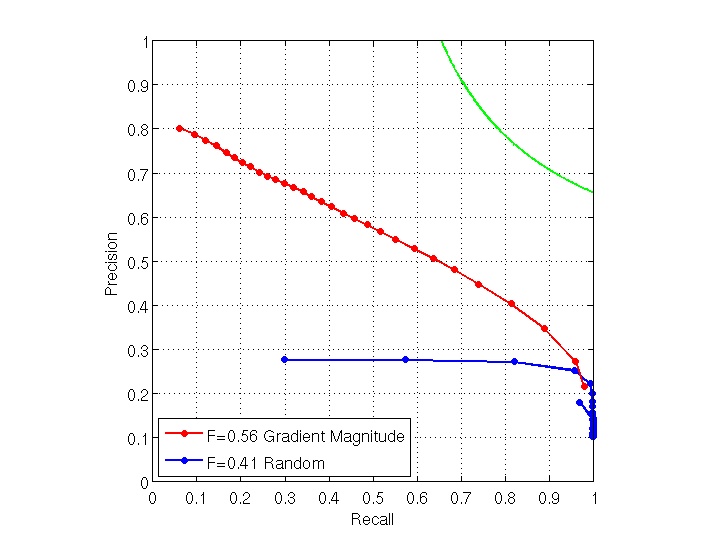
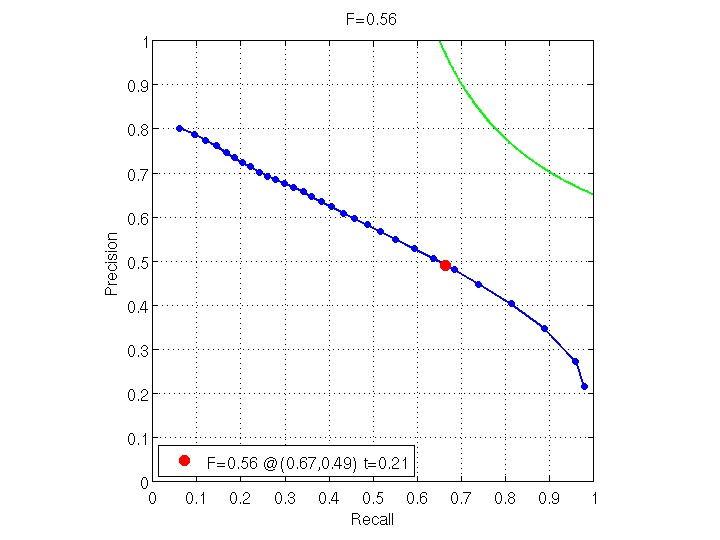
| 9 | 0.56 | Gradient Magnitude | |
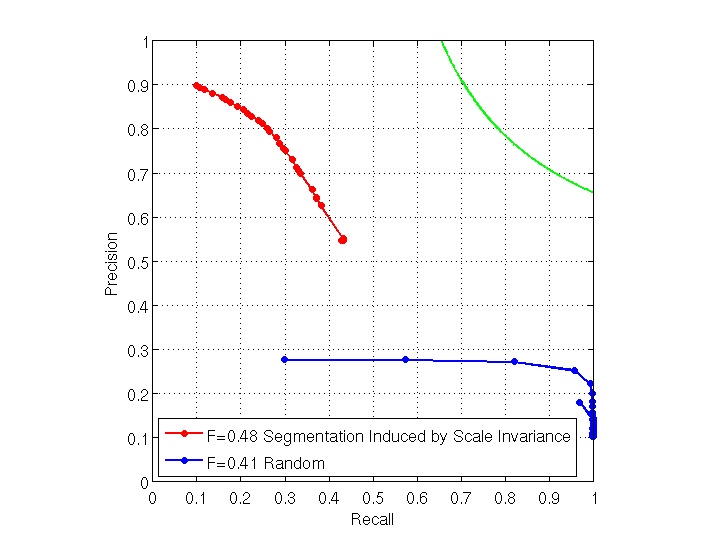
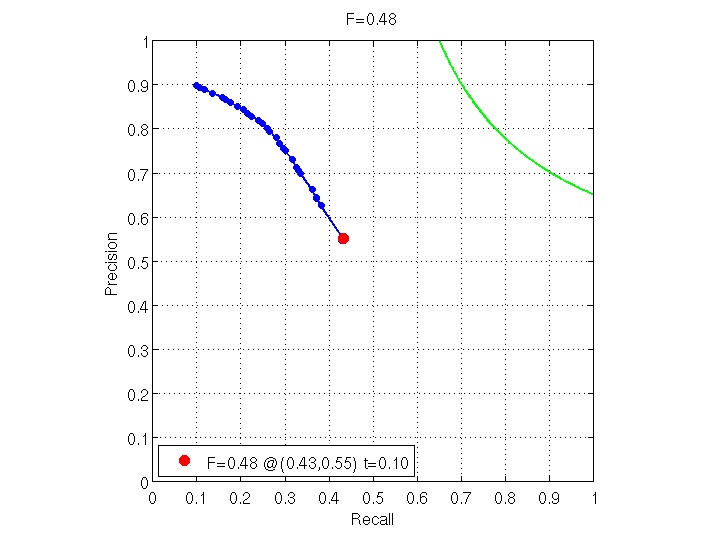
| 10 | 0.48 | Segmentation Induced by Scale Invariance | |
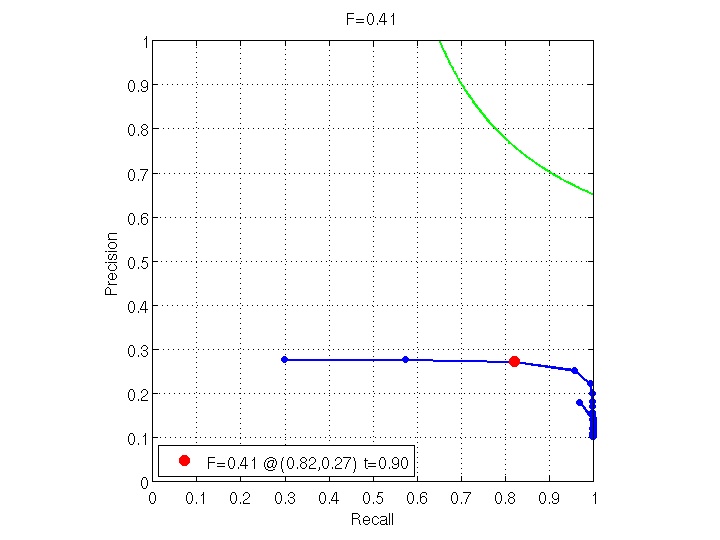
| 11 | 0.41 | Random | |
| Rank | Score | Algorithm | PR Curve |
|---|---|---|---|
| 0 | 0.79 | Humans | 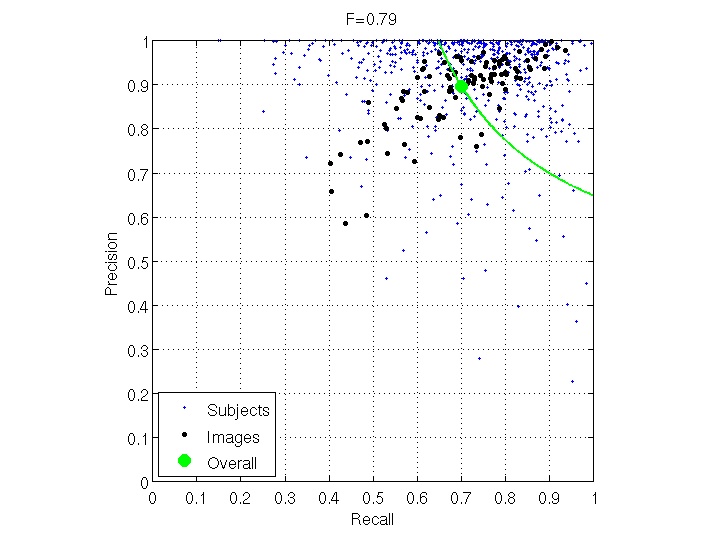 |
| 1 | 0.70 | Global Probability of Boundary (color) | 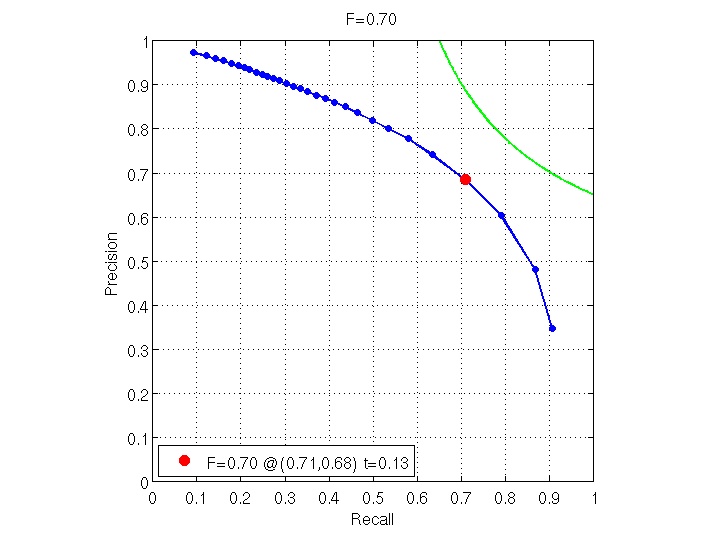 |
| 2 | 0.68 | xren (color) | 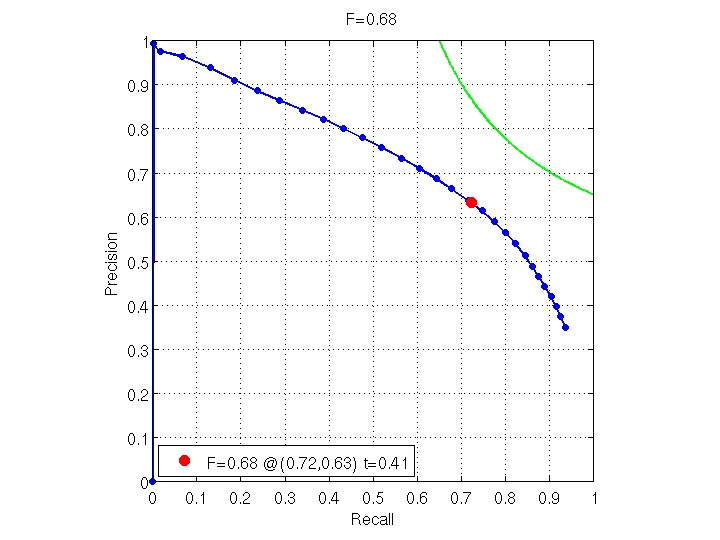 |
| 3 | 0.67 | Ultrametric Contour Maps | 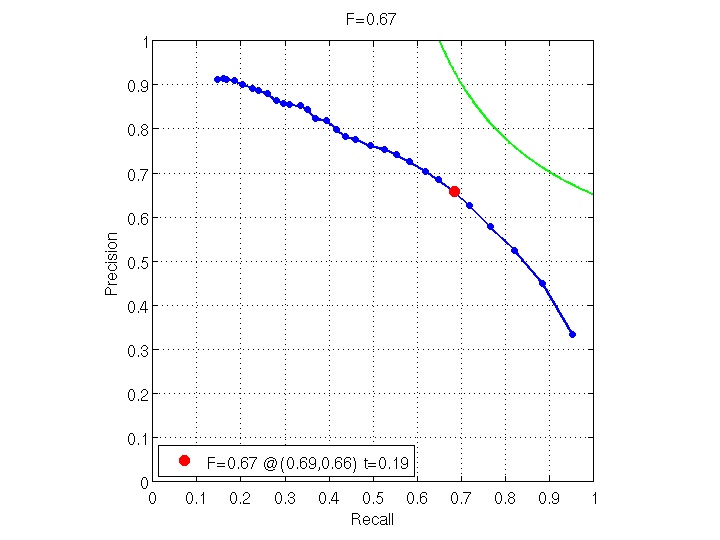 |
| 4 | 0.66 | Boosted Edge Learning (color) | 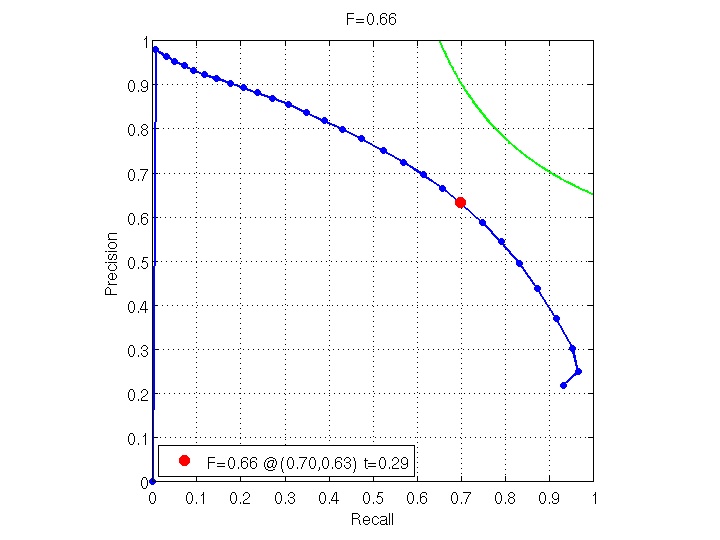 |
| 5 | 0.65 | min-cover | 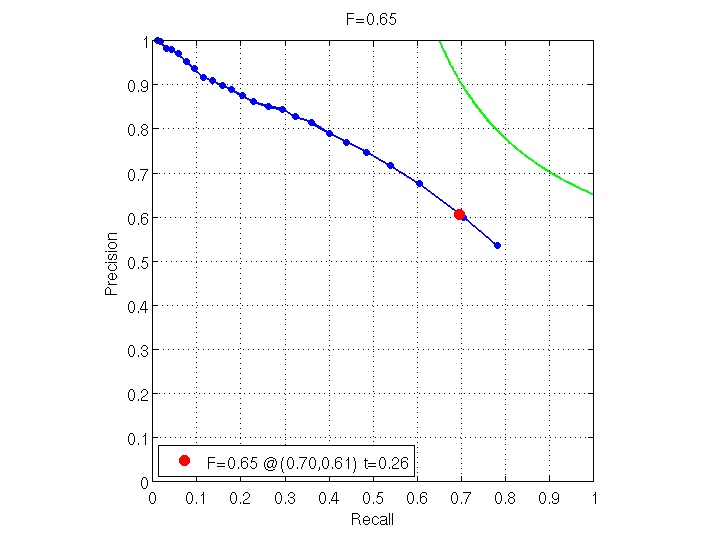 |
| 6 | 0.65 | Brightness / Color / Texture Gradients | 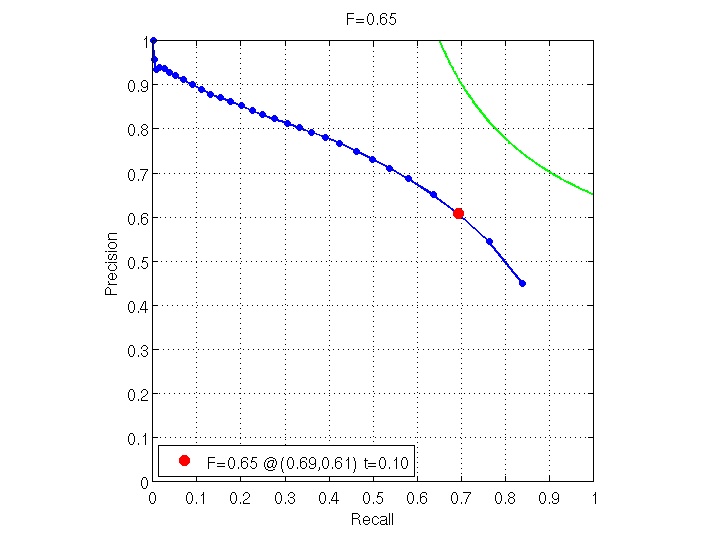 |
| 7 | 0.63 | Brightness / Texture Gradients | 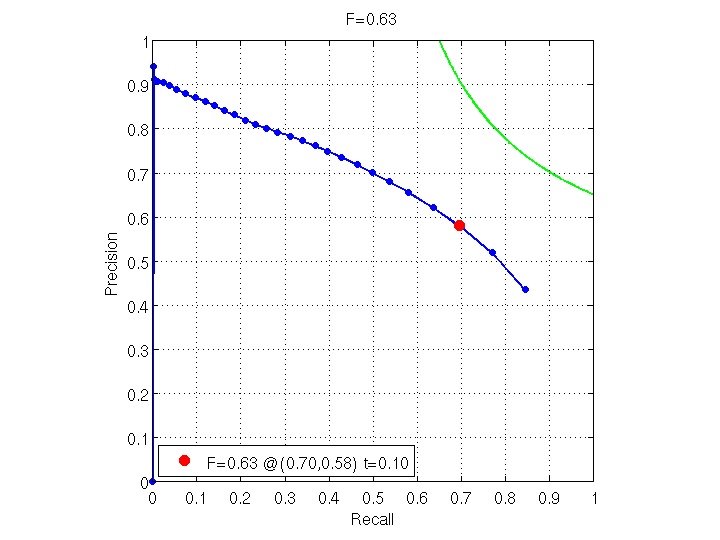 |
| 8 | 0.57 | Color Gradient | 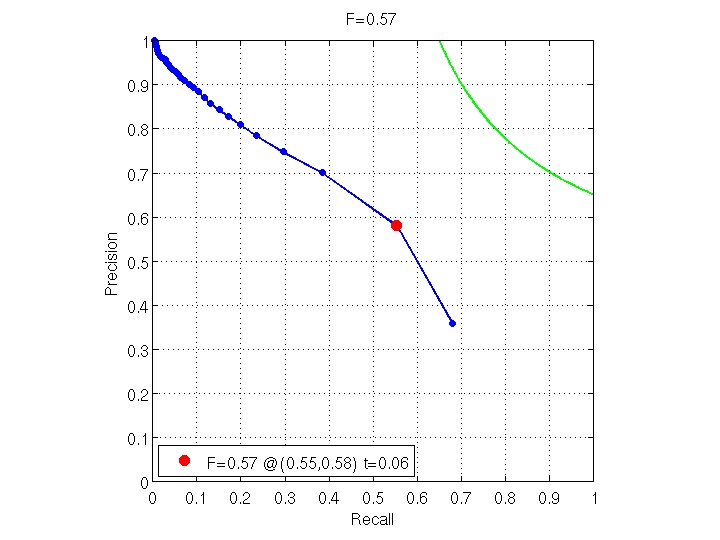 |
| 9 | 0.43 | Random | 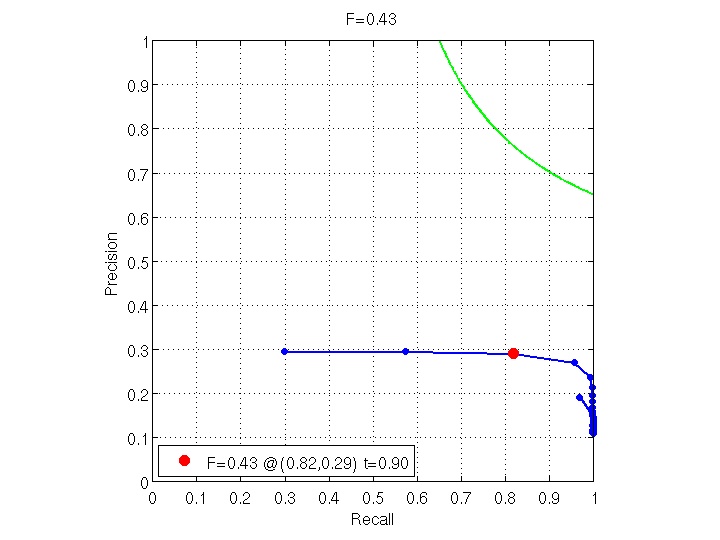 |
Page generated on 14-Jan-2009 15:57:58.