CS294-2
Visual Grouping and Object Recognition (Prof. Jitendra Malik)
November
24, 1999
Lecture
23: 3D Object Recognition (cont.)
Scribe
Notes by Shawn Hsu
Sections:
- Counterexamples to
Hypothesis I
- Hypothesis II
- Hypothesis III
- Object Recognition
1. Counterexamples to Hypothesis I
Last
lecture we talked about Goldmeir's hypothesis on how we perceive similarity
among different forms. Hypothesis I
stated that the more parts that are in common between two forms, the more
similar they appear. It then follows
that if the parts themselves are different, then the forms are less
similar. However, it could be shown
that his hypothesis is not complete.
The counterexamples to Goldmeir's hypothesis are shown below.
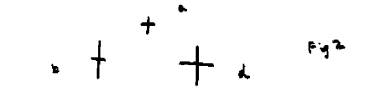
In
Figure 2, it would appear to most people that (a) and (d) are most similar,
even though there is less change from (a) to (b), since (b) is just (a) with
the vertical line extended. So,
according to hypothesis I, (a) should be most similar to (b).
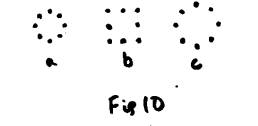
In
Figure 10, it seems like (a) and (c) are more similar. However, (b) is just (a) with some points
moved further out, while (c) is (a) with all the points moved outward. Again, hypothesis I would conclude that (b)
is more similar to (a), even though to us (c) would appear to be more similar
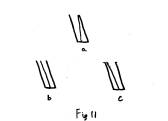
to (a). Another case is shown in figure
11. Most people would pick (c) to be
more similar to (a). However, from
hypothesis I, (b) should be more similar to (a) because the center line moved
less in (b), while the line moved more in (c).
2. Hypothesis II: Similarity as identity of
relations
We
have shown with the previous figures that there are numerous counterexamples to
Hypothesis I. Hypothesis II states that
proportional changes of parts of a figure result in a more similar figure. This would require the figures to have
homologous parts. The examples are
shown below.
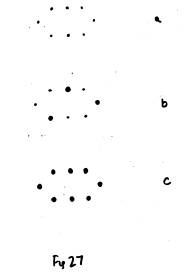
In figure 27, we would
normally perceive (a) and (c) as being most similar. However, comparing (a) to (b), it could be seen that (b) is the
same as (a), except three of the points are larger, while in (c), all of the
points have been enlarged. This would
be a counterexample to hypothesis I, but in this case it supports hypothesis
II. Hypothesis II would explain this
phenomenon as the result of (c) being the proportional enlargement of all the
points in (a), which makes the figures look similar.
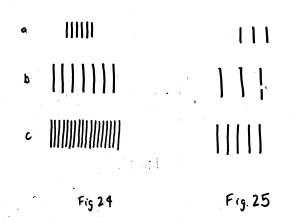
Figure 24 is used as a
counterexample to hypothesis II. In
this case, we would normally perceive (a) and (c) to be most similar, even
though (b) is the result of proportional expansion of the space between the
lines in (a). Hypothesis II, in this
case, would conclude that (a) and (b) would be most similar. For figure 25, less lines are used, and now
it appears (a) and (b) are most similar.
3. Hypothesis III
Hypothesis
III: The similarity of figures is related to differences and agreements of phenomenally
realized qualities, as opposed to logically constructible attributes. Two examples of such qualities are:
a)
Variations
of Groupings
b)
Singular
Values
Phenomenon: Human observers don't perceive
a collection of points, instead we extract something "special" from
these points. We can think of this
"special" quality as being a phenomenon.
3.1
Variations of Groupings
Examples
of finding similarity in different forms through variations in groupings are
shown below.
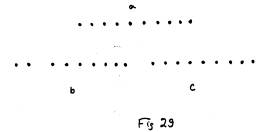
In
figure 29, (b) and (c) both have 9 points, but we would normally perceive (a)
and (c) to be most similar, even though (a) has 10 points. This is because we group (a) and (c) as one
line, while we group (b) into 2 lines.
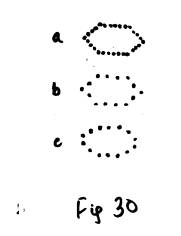
Another example for grouping is shown in figure 30. We would perceive (a) to be more similar to
(b), even though (b) and (c) have the same number of points. This is because we perceive (a) and (b) as a
hexagon, while we perceive (c) as an ellipse.
The way these points are grouped is more important than the actual
points themselves.
3.2
Singular Values
There
are some special configurations of forms that we can visually detect. Examples of singular values include
parallelism, verticality, and symmetry.
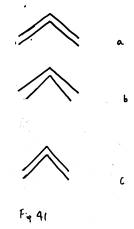
In
Figure 41, we perceive (a) to be most similar to (c). This is due to the fact that the lines show parallelism in the
two figures.
3.3
Reasons for the development of the Human Visual System
Let's
digress a bit and talk about why our visual system has this kind of similarity
measure. It can be argued that this
similarity measure allows us to recognize classes of similar objects that are
not exactly the same. In nature, it is
almost always the case that objects in the same class (ex. tigers, penguins,
trees) do not look exactly the same, but we must be able to deduce that they
belong to a certain class. There are
two reasons why the perceived shapes of objects in the same class are going to
vary.
- 3D shape of the object
within a class could be different
- the 3D to 2D
transformation of an object could introduce different poses
The
reasons listed above can introduce variations in:
- Metric Features
(lengths, angles, etc.)
- Grouping
- Singular Features
(parallelism, symmetry, etc)
Metric
Features – There are a lot of variations within a category in metric features,
which arise from both 3D variation and pose.
This is not a reliable indicator for finding similarity.
Grouping
– This feature changes a lot less than metric features. We group features together the same way,
even though the pose could change.
Grouping offers a more accurate measure of similarity.
Singular
Features – This feature is preserved under certain projections (ex. parallelism
is preserved under orthographic projection).
Symmetry is also preserved, such as in a picture (perspective
projection).
The
conclusion is that our visual system is developed as a way to recognize these
classes of objects despite of the differences in the appearance of objects in
the same class. One can argue that the
way our visual system determines the similarity of objects came about because
we can use features such as grouping, parallelism, symmetry, etc, to more
accurately recognize an object, while other features such as length and height
change too much due to variations in 3D form and 2D pose to provide a good
measure of object similarity.
4. Object Recognition
4.1
Suggested Approach to Object Recognition
First,
take the object/image and describe it hierarchically as a tree of groups. Then, look at each group and note the
singular features of each group. We
describe three attempts at using this approach.
4.2
Binford – Generalized Cylinders (1971)
Binford
proposed that each part could be modeled as a cylinder, and the relationships
between these cylinders could be described.
A generalized cylinder could be specified by three qualities:
cross section, axis, and sweeping rule.
While the definitions of cross section and axis should be clear, we need
to define sweeping rule. Sweeping rule
determines how the cross section changes as the axis is traversed. So, in the case of a regular cylinder, the
cross section is a circle, the axis is a straight line extending from the
circle, and the sweeping rule dictates that the size of the circle remains the
same. We have more examples below.
Example
1: Cone
Cross
Section – circle
Axis
– straight line
Sweeping
Rule – cross section decreases linearly
Example
2: Cube
Cross
Section – square
Axis
– straight line
Sweeping
Rule – cross section stays constant
Example
3: Torus
Cross
Section – circle
Axis
- circle
Sweeping
Rule – cross section stays constant
We
can specify many shapes with few parameters using generalized cylinders. But why do we do this? The reason is because we want to recover 3D
shapes from 2D images. We can determine
the 3D structure of an object depicted as a 2D line drawing. We want to do the same with our
algorithm. Generalized cylinders offer
us a way to use a small number of parameters to represent a 3D shape. We can recover 3D shapes given a limited
amount of image data. One insight of
this theory is that a small number of parameters can represent many
shapes. Another insight is that we can
use these parameters to deduce the shape of a 3D object in a 2D image, where
some of the 3D information is lost.
The criticism of generalized cylinders is that they are not general enough. Generalized cylinders could not be used to represent complex objects. In order to represent complex objects, more parameters need to be used. We would reach a point where there are too many parameters, and the theory collapses.
4.3
Hoffman & Richards – Parts at Concavities (1984)
The
goal of this theory is to explain how to segment objects into parts. The proposed rule is that we segment at the
negative curvature extrema. This makes
finding the figure/ground problem very important, because depending on whether
an edge is on the figure or ground, the segmentation changes. For example, in the face/vase illusion, the
segmentation changes depending on whether the figure is perceived as a face or
a vase.
What
could we find out about the actual surface from information about the occluding
contour? Koenderink showed that the
sign of the curvature of the occluding contour is the same as the sign of the Gaussian
curvature on the surface (Koenderink's Theorem).
4.4
Biederman – Geons (1987)
This
is an extension of the generalized cylinders theory. Biederman used the same idea, but then quantized the parameters
so that each parameter could only be changed to certain cases. For example, axis would be set to either be
straight or curved. Biederman renamed
generalized cylinders to Geons.